Big Data Visualization Tools
Written by TSL
August, 26, 2016
A. Introduction
With the modern Internet technologies, automation and various Webscale,
enterprise, cloud, and data computing in the competitive data-driven market and
Internet-based economy, data at low storage cost and fast processing explode
ubiquitously in both public and private sectors (Gartner, 2016). Big Data, a
generic term for data in 5V’s (massive Volume, Variety in different forms, high
Velocity in processing, truthful Veracity, and Value) pose major challenges in
capturing and extracting meaningful information to many organizations (Davis,
2016). Recently, many organizations use data visualization and analytics to
retrieve insights from their data asset for making sound decisions, increasing
productivity, acquiring new customers, or gaining a competitive edge. Today, there
are many visually analytical tools to perform big data analytics, particularly
data visualization for presentations in the market. For example, Machlis (2011)
provided twenty-two free data visualization tools for analytics; Jones (2014)
listed ten leading data analytics tools in the business market, and Lurie
(2014) addressed more than thirty-nine data visualization tools for cloud
computing.
This document will present ten big data
visualization tools that are available in the data-driven market. It includes a
short descriptive summary, typical features, colorful snapshots, highlighted
benefits or advantages, and some drawbacks or disadvantages. Ten visualization
and analysis tools are R Project, Google Fusion
Tables, Tableau Public, VIDI, Google Chart Tools, Splunk, Qlikview, KNIME, IBM
Watson Analytics, and Microsoft Power
BI. All of them are free for basic applications with limited memory space
(e.g., less than 500 MB per day). Some vendors of these advanced products offer
a free download, training, and support services, but the others may require
users to use subscription services for large enterprise projects.
B. Big Data Visualization Tools
Many big data visualization tools have emerged in
popularity over the past few years. Imanual (2015) from Predictive Analytics
Today News addressed that data visualization tools make significant impacts in
organizational presentations of the results. They play a crucial role in
understanding data analytics outcomes. Ten of the most popular data
visualization tools are addressed as shown below:
1. R project
a. Summary
R Project is perhaps one of the most analytical tools in
big data analytics and data visualization (Minelli, Chambers, & Dhiraj
(2013). It is an open-source programming language developed for ease of use. R
is the first choice in statistical analysis such as processing massive datasets
in building data models with multi-purpose capability visualization. Its
platform includes Linux, Mac OS X, Windows XP and later. Its skill level is 4
for users who are experienced programmers.
b. Benefits
Users use R for the applications to find hidden patterns
and unknown correlations, in-depth relationships in statistics. R can be
integrated with Apache Hadoop, MapReduce or SQL Server. It has the capability
in data visualization. Google uses R for statistics, data manipulation, and
visualization in many services. Facebook uses R to create statistical reports
to improve news feed and services. R language was also recommended to use in
other fields such as healthcare, manufacturing, and marketing. R becomes popular
in R communities because it is free.
c. Drawback
Notice that both R and Apache Spark are the popular big
data analytics tools today. However, R has slower performance than Spark does
because it uses memory in the hard disk drive. Users who use R are usually the
experienced or highly skillful programmers because R requires the command
lines.
Figure 1: R Studio GUI displays a large dataset of “extyags.nw”
from one of the R library packages.

Source: Adapted from CTU CS872 Unit
4 Individual Project, 2015.
2. Google Fusion Tables
a. Summary
Google Fusion Tables is a Web-based service for data
management used to gather, visualize and share data tables. Data are captured
and stored in multiple tables for viewing or download. It provides dataset
visualization and mapping. Its platform is a browser such as Chrome, Netscape,
etc. (Halevy, & Shapley, 2009).
b. Benefits
Data
can be displayed visually in different forms such as bar charts, pie diagrams,
line plots, timelines, scatter plots, or geographical maps. The data can be
exported in a comma-separated values file format. It has a skill level 1 for
users who have some basic spreadsheet knowledge. Google Fusion Tables is free
and easy to use.
c. Drawback
It has a limitation on customization and functionality in
interacting on the massive datasets. The files that are uploaded to Google
servers are limited to 250 MB for each user. Google supports data sets of 100
MB.
Figure 2: Google Fusion Tables
displays the US map data.

Source: Adapted from http://www.computerworld.com/article/2507728/enterprise-applications/enterprise-applications-22-free-tools-for-data-visualization-and-analysis.html?page=3#fusiontables,
2015.
3. Tableau Public
a. Summary
Tableau Public is an analytical tool for interactive data
visualization focused on business intelligence that uses a database
visualization language (VizQL). Users can use Tableau Public to query data in the
tables from relational and cloud databases, or Excel spreadsheets then generate
many graphs combined into dashboards or shared over the Internet or networks.
Tableau platform includes Windows, OS X. It skill level is rated 3 for power
users (Chabot, 2014).
b. Benefits
Tableau is a powerful analytical tool in industries
because it captures and extracts insights for data visualization presentation.
Its software has won many awards for the Best Use Overall in data visualization.
With the limitation of million rows, Tableau Public provides a practical
playground for individual use. Tableau's visual information provides users a
great means to verify hypotheses timely, explore the data, and check sanity (Jones,
2014). Tableau Public and Tableau Reader are free but its cousins such as
Tableau Mobile, Tableau Desktop, etc. require subscription services.
c. Drawback
Tableau Public and Tableau Reader are free, but other
products such as Tableau Desktop, Server, Online must be paid for an annual
subscription. Tableau Public does not have the ability to create multiple
dimensions in a custom group. Its limitation of creating new relationships
arises in the configuration of new knowledge. At skill level 3, Tableau Public
is useful for power users or programmers.
Figure 3: Screenshot of Tableau
Public.

Source: Adapted from https://public.tableau.com/s/,
2016.
4. VIDI
a. Summary
VIDI includes a set of the Drupal modules for creation of
visual data displays. Users can display changes in data values over time in
geographical maps or present static datasets in various types of charts in the
Drupal system of the content management. VIDI platform is a browser with a
skill level of 1 (Dataviz.org, 2016).
b. Benefits
VIDI can capture patterns, essential themes in huge data
sets very rapidly through visual means. It has many mapping options in Many
Eyes at the file size of 5 MB with colorful customization. Visualization wizard
makes the tool ease of use.
c. Drawback
The VIDI tools to create these visual representations are
usually too expensive and challenging for smaller news organizations and
everyday citizens to use. Embed code iframe may not display properly on VIDI
website.
Figure 4: VIDI’s wizard displays a
graphic on the HTML page.

Source: Adapted from http://www.computerworld.com/article/2507728/enterprise-applications/enterprise-applications-22-free-tools-for-data-visualization-and-analysis.html?page=5#vidi,
2015.
5. Google Chart Tools
a. Summary
Google Chart Tools (GCT) provides a simple set of API to
build customarily interactive SVG charts. GCT can visualize date at elsewhere. It
supports organizational charts and geographic chart. It also provides analytics
dashboard for creating an analytics page with time frame filters for charts visibility
(Konforti, 2012). The platform bases on code editor and a browser. It is rated
at a level skill of 2 (Machlis, 2016).
b. Benefits
Google Chart Tools module includes a built-in library for
visualization applications. Its service is rated excellently. The comprehensive
API sets can take data in from a Google spreadsheet. Google Chart Tools are
powerful, simple to use and free.
c. Drawback
Google Charts do not allow users to download the
google.load or google visualization code for offline using. User charts that
use Google Chart Tools module will not work on IE8 (Internet Explore version 8)
because IE8 does not support SVG feature.
The
API requires some coding that pushes it more programming tool.
Figure 5: Google Chart Tools
displays an analytics dashboard.

Source: Adapted from Konforti, 2016.
6. Splunk
a. Summary
Splunk is a data visualization tool used to search,
monitor and analyze big data generated by machines or sensors through Internet
browsers or Web-based interface. Splunk can capture, provide indexes, and
correlates real-time data for charts, graphs, diagrams, reports, dashboards,
and visual displays (Harris, 2010). Its platform includes Windows 7, 8, 10, and
Windows Servers, Linux, Solaris, and Intel ICX 10.9.
b. Benefits
Splunk provides machine-generated data accessible across
an organization by providing metrics, identifying data patterns, diagnosing
problems and providing intelligence for business operations. It can connect to
any database sources for analysis.
c. Drawback
Splunk builds on data indexing on the logs generated by
machines and sensors, but it does not keep in view Business Intelligence
objectives.
Figure 6: Splunk displays a search on all machine data
in a real time.

Source: Adapted from http://www.splunk.com/en_us/products/splunk-enterprise/features.html,
2016.
7. Qlikview
a. Summary
Qlikview has the ability of simple drag and drop
techniques in self-service in the creation of data visualization without
writing many SQL query commands. Qlikview can connect various databases from
different vendors into Qlikview's centralized repository. It has intelligent
indexing method to discover new data for patterns and trends in different data
types. Qlikview provides dashboards to aid decision support systems. Its
platform uses 64-bit Windows with a skill level of 2 (Qlik, 2015).
b. Benefits
Qlikview accepts dynamic data type formats from any source
to its in-memory analytics platform. It has many channels of documentation for
building big data quickly without disruption without downtime.
c. Drawback
Schemaless or dynamic schema is not used to connect to the
data source in Qlikview. It does not have a powerful graphics in comparing with
Tableau’s. Qlikview is not a free product, but Qlik Sense is free.
Figure 7: Qlikview displays a sample
analysis.

Source: Adapted from http://www.computerworld.com/article/2920545/business-intelligence/qlik-sense-free-dataviz-app-adds-public-private-sharing.html,
2015.
8. KNIME
a. Summary
KNIME is an open source platform for data integration,
analytics, and reporting. It
allows
users to program visually for analyzing, manipulating, and modeling data in a credibly
intuitive way. It uses machine learning and data mining to integrate various
components through modular data pipeline concept. Users can drag connection
points or drop nodes onto a canvas between activities (Abhishek, & Arvind,
2007).
b. Benefits
KNIME is powerful analytics with vast native nodes
integration in visualization with the easy-to-learn graphical interface. It is
scalable and reliable within the infrastructure. It can run R, Python, text
mining, chemistry data, etc. for more advanced
code driven analysis. KNIME is a free and easy-to-use tool.
c. Drawback
KNIME’s main disadvantage is the preliminary results are
not available while the real pipeline was used, for example, sending and processing
single rows right after they are created (Meinl, Cebron, & Gabriel, 2009).
Figure 8: KNIME displays an
analytics process and Platform GUI.


Source: Adapted from https://www.knime.org/knime-analytics-platform,
2016.
9. IBM Watson Analytics
a. Summary
IBM Watson is a question answering computing for machine
learning, retrieving information, presenting knowledge, and automatically
reasoning. It has a capability to find the correct answer after running a hundred
algorithms of proven language analysis. IBM Watson’s applications are often used
in financial services, telecommunication, healthcare, and government, and game
contests such as Jeopardy (Thomson, 2010). Users are not required to know
statistics because IBM Watson computes all in the background. IBM Watson also
provides visualization and analysis applications based on the browser with the
level skill of 1.
b. Benefits
IBM Watson is an analytics tool that has an ability to retrieve
major information from all documents, provide hidden patterns, insights, and
correlations across huge data sets. 80% data are unstructured in various forms
such as new articles, online posts, research papers, or organizational system
data (Thomson, 2010). It is a free tool.
c. Drawback
IBM Watson has a slow response to understand the contexts
of the clues. In healthcare, IBM Watson assists to identify treatment options
for patients, but it has never had a chance in the process of medical
diagnosis. It is still in beta stage with more upgrading versions to come.
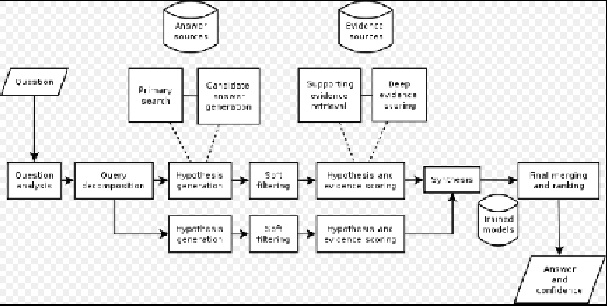
Figure 9: IBM Watson Architecture in
a deep question answering computing.
Source: Adapted from https://www.ibm.com/analytics/watson-analytics/us-en/,
2016.
Figure 10: IBM Watson shows high
diamond prices below.

Source: Adapted from https://www.ibm.com/analytics/watson-analytics/us-en/,
2016.
10. Microsoft Power BI (Business Intelligence)
a. Summary
Microsoft
Power BI is a business analytics tool for analyzing data and providing
insightful information similar to Excel’s Power Query. It can be used for
monitoring the business and sharing timely answers on the convenient
dashboards. With drag-and-drop features, Power BI use natural language to
report data in a visual format or find good responses to difficult questions
(Power BI, 2016).
b. Benefits
Microsoft
Power BI platform provides better price-performance ratio for data
visualization (DV) with the most robust set of BI and DV modules such as SQL, Sharepoint,
Server, Analytical Reporting and Integration Services, Excel 2010 with
PowerPivot add-in.
c. Drawback
Power BI’s implementation is about average with good
scalability and good data integration, but its dashboard support is weak.
Figure 11: Microsoft Power BI
displays airlines’ departure and arrival delays.

Source: Adapted from http://www.computerworld.com/article/3088958/data-analytics/free-data-visualization-with-microsoft-power-bi-your-step-by-step-guide-with-video.html,
2016.
E. Summary
This document presented a descriptive
evaluation report of ten advanced big data visualization tools that were used
for answering most of the difficult questions, extracting meaningful
information, and revealing insights, hidden patterns or correlations across
data in various sources in the data-driven market. They included R Project,
Google Fusion Tables, Tableau Public, VIDI, Google Chart Tools, Splunk,
Qlikview, KNIME, IBM Watson Analytics, and Microsoft Power BI. For each
analytical tool, a descriptive summary, typical features, graphical snapshots
of the images, benefits, and drawback were described with highlighted information
from a variety of the scholarly resources and credible websites.
In summary, this document described ten advanced data
visualization tools to present big data visualization results and outcomes from
the robust analyses in today’s data explosion market.
REFERENCES
Abhishek, T., & Arvind, S. (2007).
Workflow based framework for life science informatics. Computational
Biology and Chemistry.31 (5-6):
305–319.
Chabot, C.
(2014). How to get a 20 million dollar pre-money for series a:tableau software.
Retrieved August 22, 2016 from
http://www.sramanamitra.com/2010/03/05/how-to-get-a-20-million-pre-money-valuation-for-series-a-tableau-software-ceo-christian-chabot-part-3/
Dataviz.org,
(2016). How it works. Retrieved August 23, 2016 from
http://www.dataviz.org/how-it-works
Davis, J. (2016).
2016 Gartner Magic Quadrant for Business Intelligence and Analytics Platforms.
Retrieved August 21, 2016 from
http://www.informationweek.com/big-data/software-platforms/gartner-bi-magic-quadrant-inflection-point-has-arrived/d/d-id/1324233
Gartner Group
(2016). Gartner BI magic quadrant: inflection point has arrived. Retrieved June
4, 2015 from
http://info.birst.com/AR-Gartner2016CriticalCapabilities_LP.html
Halevy, A., & Shapley, R. (2009). Google fusion
tables. Retrieved August 22/2016 from
https://research.googleblog.com/2009/06/google-fusion-tables.html.
Harris, D.
(2010). How splunk is riding it search toward an ipo. Retrieved August 23, 2016
from https://gigaom.com/2010/12/17/how-splunk-is-riding-it-search-toward-an-ipo/
Imanuel (2015).
50 big data platforms and big data analytics software. Predictive Analytics
Today. Retrieved on November 16, 2015 from
http://www.predictiveanalyticstoday.com/bigdata-platforms-bigdata-analytics-software/
Jones, A. (2014).
Top 10 data analysis tools for business. Retrieved August 21, 2016 from
http://www.kdnuggets.com/2014/06/top-10-data-analysis-tools-business.html
Konforti, R.
(2012). Google chart tools. Retrieved August 2016 from
https://www.drupal.org/project/google_chart_tools.
Lurie, A. (2014).
39 Data Visualization Tools for Big Data | ProfitBricks Blog. Retrieved August
21, 2016 from
https://blog.profitbricks.com/39-data-visualization-tools-for-big-data/
Machlis, S.
(2011). 22 free tools for data visualization and analysis. ComputerWorld.
Retrieved August 8, 2016 from http://www.computerworld.com/article/2507728/enterprise-applications/enterprise-applications-22-free-tools-for-data-visualization-and-analysis.html
Meinl, T.,
Cebron, N., & Gabriel, T. (2009). The konstanz information miner 2.0.
Reterived August 23.2016 from
https://kops.uni-konstanz.de/bitstream/handle/123456789/5762/main.pdf;sequence=1
Microsoft Power
BI (2016). Bring your data to life. Retrieved August 23, 2016 from
https://powerbi.microsoft.com/en-us/?WT.srch=1&WT.mc_id=AID529580_SEM_uDaUULKn&utm_source=Google&utm_medium=CPC&utm_term=microsoft%20power%20bi&utm_campaign=Power_BI&gclid=Cj0KEQjw6O-9BRDjhYXH2bOb8Z4BEiQAWRduk_e-USXb3hqcbKLjs43WZuqXyMhACPamjd1J7Nwju6UaAkL_8P8HAQ
Minelli, M., Chambers,
M., & Dhiraj, A. (2013). Big
data, big analytics: emerging business intelligence and analytic trends for
today's businesses. John Wiley & Sons.
Qlik (2015). Make stunning data
discoveries . Retrieved November 2, 2015, from
http://www.qlik.com/products/qlik-sense
Thomson, C.
(2010). What is i.b.m.’s watson? Retrieved August 23, 2016 from
http://www.nytimes.com/2010/06/20/magazine/20Computer-t.html?_r=0
Nice article in breaking down the various options....
ReplyDeleteThanks for reading the article.
DeleteVery well written article.
ReplyDeleteThank you - Sir !
DeleteIt was really a nice post and i was really impressed by reading this Data Science online Course
ReplyDeleteThanks for reading the article.
DeleteAwesome article, this is very helpful article. Big Data Training in Pune
ReplyDeleteThank you !
DeleteThis comment has been removed by the author.
ReplyDeleteHi! I suggest adding a description of new data visualization tools for your users. Try out the new AtomicusChart data visualization tool https://atomicuschart.com get a free trial for 3 months. I can send a press release
ReplyDeleteI keep your suggestions in mind.
DeleteWill try out AtomicusChart.
Thank you !
Thank you for this great collection! If you are looking for data visualization tool with various big data analytics solutions then Syntelli Solution is one of the best option for you.feel free to visit our website.
ReplyDeleteI keep it in mind !
DeleteThank you for this great collection! If you are looking for data visualization tool with various big data analytics solutions then Syntelli Solution is one of the best option for you.feel free to visit our website.
ReplyDeletehttps://www.syntelli.com/data-visualization-tools
Will try out - Thank you !
DeleteThanks for reading the article.
ReplyDeleteHope you learn more from reading !
ReplyDeleteThanks a lot for sharing this amazing knowledge with us. This site is fantastic. I always find great knowledge from it. Mobile Phlebotomy Software
ReplyDeleteIn the Big Data world, many technologies are coming together to solve many real-world problems. TheBig Data technologiesof are all about speed: how fast you can compute, how fast you can process, how fast you can query, and how fast you can transmit. We will spend a lot of time talking about how to keep up with the data so that analysis is not delayed, and how to keep it all organized so that you can find what you need when you need it.
ReplyDeleteThis is one awesome article.Thanks Again. Really Great.
ReplyDeletepower bi online training
power bi online course
tableau training
ReplyDelete