Design Proposal on the Cyber-Healthcare System
by TSL
September 10, 2016
In general, a design proposal is a
descriptive document of a certain product prepared by architect(s) or a design team
to provide an overall guidance of the architecture in the project to the
development team, and it is also a primary informative document of the design
to an organizational management (IEEE, 2009). The product can be a hardware
instrument, software package or a system. The design document may contain many
sections and sub-sections that include a general
overview, goals, flow chart, diagrams, specific specifications, assumptions,
and limitations, etc. (CMS.gov, 2005). In this Unit 5 Individual Project (CS882 U5 IP), a
newly hired big data analyst will present a design proposal using Hadoop
ecosystem to analyze various large structured and unstructured datasets for the
insights in a chain of the state-of-the-art hospitals and other health services
in four states (Arizona, Colorado, New Mexico, and Utah) in the US. A Hadoop
solution will address specific business problems in the healthcare field. The
design proposal consists of eight sections as follows:
I. Introduction
II. Specific requirement design
III. Data flow diagrams
IV. Overall system diagrams
V. Communication Flow Chart
VI. Regulations, policies, and governance for the medical
industry
VII. Assumptions and limitations
VIII. Justification
I. Introduction
This document provides a design proposal concerning a
Hadoop solution that is applied to the business problem of analyzing various
large data sets in a hospitals network system in four corners region, i.e., Arizona,
New Mexico, Colorado, and Utah. The design proposal of the Cyber-Healthcare
System gives corporate management a descriptive information and guidance of the
architecture in the project that solves business problems of analyzing huge
sets of scattered complex data in the healthcare system. The document is also
provided the related readers an generic informative overview of the
project.
With cloud computing, automation, Web technologies like
artificial intelligence,
Internet
of Things (IoT) in the competitive Internet-centric market and data-driven
economy, big data at low storage cost, particularly complex data in the
healthcare area, has exploded and become ubiquitous and available almost
everywhere. Analyzing mostly unstructured data at a colossal volume such as
personal health records, clinical health information, or public health data for
insights usually poses many practical challenges and real business problems to
many organizations such as hospitals, clinics, etc. in the area. For example,
presentation of the analytical results from a real-time analysis is an issue in
corporate management.
II. Specific requirement design
The design proposal of the Cyber-Healthcare System (The System) provides an overall
description of the solution in data analytics to solve the challenges and
business problems in healthcare field with the following requirements:
A. Large data sets
The broad and complex data sets processed in the
Cyber-Healthcare System that include some structured and unstructured data will
be stored in a reliable centralized on-line repository. Data sets can be
replicated and shared among nodes in the scalable distributed clusters. A
backup system will provide a safeguard and recovery if some disasters such as
hacking or risks of the loss happen. Insightful information extracted by Hadoop
system will be categorized into three categories (Schneiderman, Plaisant, &
Hesse, 2013):
1. Personal health information:
Physicians and patients collect information about their
practice and own health habits.
2. Clinical health information
Electronic health records systems can enhance a health
care or cure to patients, and useful insights into pragmatic patterns of
treatment.
3. Public health information
A large quantity of public health data is collected to
assist policy makers in more reliable decisions.
Figure 1: Big data in healthcare area includes structured
data and unstructured data in the 2/3 section of the data pie.

Source: Adapted from AllSight
(2016).
B. Hadoop ecosystem
To extract and
transform the complex, huge data sets of healthcare for insightful information,
the Cyber-Healthcare System will implement and deploy the Hadoop ecosystem to
hospitals in the area. As the de facto standard to manage big data, Apache
Hadoop - an open source Java-based framework that uses parallel data processing
across distributed clusters - is chosen for this project (Apache Software
Foundation, 2014). A simplified Hadoop architecture includes four major
components:
1. Hadoop Common
The component
consists of Java libraries and utilities to support other components.
2. Hadoop YARN
The component
does job schedules and manages cluster resources.
3. HDFS (Hadoop Distributed File System)
The HDFS
provides high-throughput access to application data.
4. Hadoop Map/Reduce
It performs Map
and Reduce functions on large data sets in parallel processing to retrieve
insightful health information for patients, clinics, and hospitals.
Figure 2 shows
a simplified Hadoop framework with four components: YARN Frameworks, Common
Utilities, HDFS, and Map/Reduce Computation.

Source: Adapted from
Hadoop Software Foundation, 2012.
Figure 3 displays
a high-level HDFS architecture with name node and multiple data nodes in data
processing.

Source: Adapted from Borthakur (Apache Hadoop
Organization, 2012).
Healthcare tools in the Cyber-Healthcare
System are designed to assist health authorities in long-term plans, business
strategies, and healthcare policies. The healthcare tools include diagnostic
tools for monitoring. evaluating, and assessing. Other tools are used to
support priority scheduling, identify effective strategies, evaluate the cost, plan
resource, calculate budget, and program and implement tasks (WHO, n.d.).
C. External interfaces
The
Cyber-Healthcare System will allow related users such as nurses, physicians, to
enter data or view and search health information in the Hadoop ecosystem.
Patients can access and view their health records only. However, administrators
and designers have privileges and authorization in options such as
read/write/delete/save or change.
1. User interface
There
is one unique graphic user interface (GUI) for three types of users.
- The GUI with basic privilege
is provided to patients who can read, view, print out individual health
records, information. They can schedule appointments, send emails for
questions, etc.
- Nurses, physicians or data entry
workers are provided more privileges such as to read, view health information,
enter data, search or query for useful information, etc. on the GUI.
- Administrators and designers
have full privileges such as read, write, delete, change, query, extract data,
etc. with full privileges on the GUI.
2. Hardware interface and software interface
The Cyber-Healthcare System with a backbone
of Hadoop environment supports NoSQL databases, aggregate data models, and
key-value databases to perform the map-reduce computing and store the
results of the mappers and the reducers in the materialized views with high fault-tolerance. Users can
use industry standard formats like XML, JSON, texts on complex data.
The
hardware interface comprises personal computers, desktops, laptops,
Smartphones, iPhones, iPads, etc. (Natarajan, 2012).
Software
interface includes:
a. Platforms:
- OS Windows 7, 8, 8.1, 10
(32-bit, 64-bit)
Windows
Server 2008 (64-bit)
Windows
Server 2012 (64-bit)
Windows
Server 2012 R2 (64-bit)
Windows
Vista SP1 and later (32-bit and 64-bit)
- Mac OS X hosts (64-bit)
Mavericks: 10.9
Yosemite: 10.10
EI
Capitan: 10.11
- Linux hosts (32-bit or
64-bit)
Ubuntu
10.04 to 16.04
Debian
GNU/Linux 6.0 (“Squeeze”) and 8.0 (“Jessie”)
Oracle
Enterprise Linux 5, Oracle Linux 6 and 7
Redhat
Enterprise Linux 5, 6 and 7
Fedora
Core / Fedora 6 to 24
Gentoo Linux
openSUSE
11.4 to 13.2
- Solaris hosts (64-bit
only)
Solaris
11
Solaris
10 (U10 and higher)
b. Emulated hardware
- Input devices: Standard
PS/2 keyboards and mouse
- Graphics: Standard VGA
devices
- Storage: Intel
PIIX3/PIIX4 chips, the SATA (AHCI) interface, and two SCSI adapters (LSI Logic
and BusLogic)
- Networking: Linux
kernels version 2.6.25 or later
Windows
2000, XP and Vista, drivers
- USB: xHCI, EHCI, and OHCI
3. Nonfunctional requirements
a. Security:
General
security principles are used securely
-
Update software
-
Safeguard Network Access to High Priority Services
-
Obey the Least Privilege Principle
-
Watchdog System Activity
-
Maintain and upgrade on the Latest Security Information
b. Performance
-
Poor performance caused by host power management
-
Performance variation with frequency boosting
c. Policy
Cyber-Healthcare System
works in harmony based on trained and motivated health workers’
inputs. It is designed in a well-logic infrastructure,
and a stable supply of technologies and medicines, supported by well funding, powerful health plans and make-sense policies (WHO, n.d.).
and a stable supply of technologies and medicines, supported by well funding, powerful health plans and make-sense policies (WHO, n.d.).
d. Business rules
Business rules explain the definitions,
operations, and constraints that use in the Cyber-Healthcare System. The users
who use the Cyber-Healthcare System are required to follow all the rules in the
signed agreement when they sign up or join the System.
III. Data flow diagrams
Healthcare
data is processed dually in traditional databases in data warehouse and Hadoop
in ETL (Extract, Transform, and Load) process in parallelism as shown in
Figures 4, and 5 below:
Figure 4: Process flow of the large
healthcare data in Map/Reduce functions in Hadoop system.
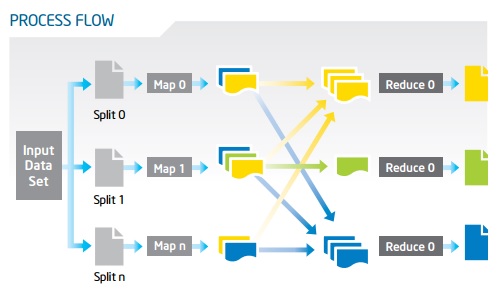
Source: Adapted from
Intel, 2016.
Figure 5: Data flow in both
traditional data warehouse and Hadoop subsystem in parallelism in the
Cyber-Healthcare System. Data science means data analytics that is a process of
data analysis for retrieval of insights.

Source: Adapted from
Intel, 2016.
In the Cyber-Healthcare System, a
XML data flow document can be written in XML format. For example, a typical XML
design document is programmed as follows:
<?xml
verson=”1.0”?>
<!—File
name: TheCyberHealthcareSystem.xml -->
<Group>
<Groupname>Arizona</Groupnames>
<Hospital>XXX</Hospital>
<DeptInternalMedicine>AAA</DeptInternalMedicine>
….
<DeptIntensiveCare>BBB</DeptIntensiveCare>
…..
<DeptFamilyCare>BBB</DeptFamilyCare>
……..
….
<Clinic>YYY</Clinic>
…..
<Nursinghome>ZZZ</ Nursinghome>
……
<Groupname>Colorado</Groupnames>
<Hospital>III</Hospital>
<DeptInternalMedicine>OOO</DeptInternalMedicine>
….
<DeptIntensiveCare>PPP</DeptIntensiveCare>
…..
<DeptFamilyCare>QQQ</DeptFamilyCare>
……..
….
<Clinic>JJJ</Clinic>
…..
<Nursinghome>KKK</ Nursinghome>
…..
</Group>
<Patient>
<Patientname>StevenConte</Patientname>
<PatientID>7742661926</PatientID>
<PatientDOB>04301975</PatientDOB>
<PatientAddress>XYZ</PatientAddress>
<PatientOccupation>zyx</ PatientOccupation>
<PatientAge>46</PatientAge>
<PatientHeight>5ft8Inch</PatientHeight>
<PatientWeight>150</PatientWeight>
<PatientHeight>5ft8Inch</PatientHeight>
<PatientIllness>Vertigo</
PatientIllness>
…………
</Patient>
………..
IV. Overall system diagrams
The
overall Cyber-Healthcare System based upon a Hadoop ecosystem consists of a
Hadoop YARN, Common Utilities Unit, HDFS, and Hadoop Map/Reduce. Hadoop YARN is
a communication and control unit that provides job scheduling and cluster
resource management. Common Utilities Unit is a supportive unit to provide
libraries and utilities. HDFS provides accessing to health data sets. Hadoop
MapReduce applies parallel processing on the healthcare large data sets
effectively. The large data sets in Tetra Bytes are broken into 64 or 128 MB
and stored in multiple low- cost commodity nodes in HDFS for Map and Reduce
functions to retrieve insightful information for end-users such as patients,
frontline care providers (e.g., nurses, physicians, healthcare technologists,
etc.).
Figure 6 shows the overall central
Hadoop System with the control unit Hadoop YARN and supportive unit Common
Utilities in the Cyber-Healthcare System.

Source: Created by TSL, 2016
V. Communication Flow Chart
In communication, the Cyber-Healthcare System consists of
the central Hadoop ecosystem that connects to four groups, i.e., Arizona,
Colorado, New Mexico and Utah in star configuration as shown in Figure 7 below.
Each group is linked to local hospitals, outpatient clinics, nursing homes, and
rehabilitation centers. Each organization has
many
departments. Each department has its own care team or frontline care providers
that include physicians, nurses, and family members who provide health care
services to patients. Also, the environment group that comprises regulators,
Medicare, Medicaid, insurance companies, healthcare purchasers, and research
funders can communicate with institutions such as hospitals, clinics, nursing
homes, rehabilitation centers, etc.
Figure 7 depicts a high-level communication flow chart
among agencies in the Cyber-Healthcare System.

Source: Created by TSL, 2016
VI. Regulations, policies, and governance
The Cyber-Healthcare System complies
with all regulations, policies, and governance for the medical industry in its
design as follows:
1. Regulations
In practical view, market research and ethnics in
healthcare data based on Internet technology are usually at odds with each
other. Big Data Analytics (BDA) presents both technical and strategic
capabilities to generate value from the data they store for the organizations.
With the blossom of BI (Business Intelligence) and BDA, there will be more
security violation and privacy issues (Quora, 2014). There is a prominent risk
of violation of the personal privacy. For example, terrorists likely hack
healthcare systems such as the Cyber-Healthcare System to sabotage the system, harm
people, and take advantages for their own ideology, politics, or religion. The
System considers the issues seriously and uses the latest antivirus software,
firewall, etc. to protect the integrity of data and safeguard patients’
information. The System comply the government’s controversial in-depth
regulations and obeys all medical rules. Notice that the Cyber-Healthcare
System will work to obtain ISO 9001 Certification in the healthcare industry
(Nolan, 2015).
2. Privacy Policies
Information about users’ uses of the
website is collected by using a tracking cookie, and server access logs. The
collected information includes the following:
a. The IP address from which user
accesses the website.
b. The type of operating system (OS)
and browser user uses to access the System site.
c. The date and time user accesses the
Cyber-Healthcare System site.
d. The html pages users visit.
e. The pages addresses from where user
followed a link to the System site.
Some of the information is gathered by
using a tracking cookie set from the Hadoop Analytics or Google Analytics
service in the privacy policy. Users may refer the browser documentation for
instructions on how to disable the cookie if they do not want to share the data
with Hadoop or Google.
The Cyber-Healthcare System gathers
information to make the website more useful and friendly to visitors and better
understanding how and when the website is surfed. The Cyber-Healthcare System
does not collect or track personally identifiable information, or associate
gathered data with any personally identifying information from the other
sources.
By using this website, user consents
to the collection of this data in the manner and for the purpose to solve the
challenges and business problems in healthcare field (Hadoop.apache.org, n.d.).
3. Governance
HIPAA is the federal Health
Insurance Portability and Accountability Act of 1996 in Tennessee. It was
designed to safeguard healthcare information, assist people to retain health
insurance, and facilitate administrative costs’ control in the healthcare
industry (HIPAA, 1996). On the privacy issue, HIPAA emphasizes on protection
and maintenance of personal health information in all health-related
organizations. HIPAA requires (1) frontline providers (e.g., physicians,
nurses, etc.), (2) medical producers (e.g., pharmaceutical, medical device
companies, etc.), and (3) payers (e.g., insurance companies) must comply all
the law and rules in governance.
The Cyber-Healthcare System comply
all HIPAA governance rules.
VII. Assumptions and limitations
The Cyber-Healthcare System is
developed and designed based on the following assumptions and limitations:
1. Assumptions (Flower, 1999):
- The System’s clients are patients.
- The System’s contact with patients
is high intensity, low touch.
- Doctors are independent carriers of
information and judgment.
- Healthcare is event-driven.
- Much of ill health will be
predictable and preventable.
- Patients will be partners in
managing their health.
- Data in the System’s centralized
repository is assumed clean, reliable, and credible.
- All institutions such as hospitals,
clinics, nursing homes, etc. use the same platform to access, view, query, and
enter the large data sets in the centralized repository.
- All frontline care providers in the
care team are trained to use the System properly and professionally.
- The System keeps all sources of
time visible to the guest synchronized to a single time source, the monotonic
host time.
2. Limitations (Hortonworks, 2016)
- Some experimental features are beta
(labeled as experimental). Such beta features are provided but are not formally
supported. However, users’ suggestions and feedback are welcome.
- Poor performance with 32-bit AMD
CPUs may affect Windows and Solaris platforms.
- Poor performance with 3-bit Intel
CPU model affects mainly on Windows, Solaris, and Linux kernel.
- NX (no excuse, data execution
prevention) only works for 64-bit OS computers
- Windows XP has slower transmission
rates because it supports segmentation offloading.
- Shared folders are not supported on
the OS/2 computers.
VIII. Justification
The Cyber-Healthcare System is a
modern state-of-the-art system in the contemporary network of hospitals,
outpatient clinics, nursing homes, and rehabilitation centers in the 4-state
region. The System is developed to eliminate isolation among hospitals, reduce
inefficiency in care management, and prevent a loss of opportunities for
advancing patient treatments. The Cyber-Healthcare System is designed with the
following justifications:
1. Centralizing the scattered sources of
colossal data sets from many agencies, various hospitals, and clinics.
2. Transforming unreliable huge data sets
with duplication and redundancy in data and information to credible and
reliable data sets.
3. Establishing a large healthcare network
system in the region to allow users such as patients and frontline care
providers (physicians, nurses, family members) with the different privilege to
access, view, search information that is needed or required for patient
treatments, and cures at low cost possible.
4. The Cyber-Healthcare System is
implemented in Hadoop environment as described in Section II.B Hadoop Ecosystem
above.
5. The System’s architecture is developed
based on four target elements:
a. Patients.
b. Care team consists of physicians,
nurses, family members.
c. Organization includes
infrastructures, resources such as hospitals, clinics, nursing homes and
rehabilitation centers.
d. The environment comprises
regulation, policy, and market like regulators, Medicare, Medicaid, insurance
companies, healthcare purchaser, research funders, etc.
6. The System is designed to tackle the
huge data sets’ challenges in the healthcare industry. Some healthcare data
challenges are:
a. Capturing data is difficult.
b. Curation is not easy.
c. Storage requires huge memory,
disks.
d. Sharing data is complicated.
e. Transfer data take a lot of time
because of huge size.
f. Analysis of data requires advanced
analytical tools.
g. The presentation is sophisticated.
7. Organizations in the System can provide
better and high-quality services based on
historical data from previous medical records of patients.
8. The System has data visualization
feature for users to access (Schneiderman,
Plaisant, & Hesse, 2013):
- Personal
health information
- Clinical
health information
- Public
health information
IX. Summary
This
Unit 5 Individual Project document presented a design proposal of the
Cyber-Healthcare System that used Hadoop environment to process and analyze
huge data sets in healthcare in the four corners area like Arizona, Colorado,
New Mexico, and Utah. The proposal included eight sections as follows:
I. Introduction
This section provides a quick overview of the
Cyber-Healthcare System.
II. Specific
requirement design
The
section explains an overall description, external interface requirements such
as user interface (GUI), hardware interface (computers, laptops, iPad,
smartphone, etc.), software interface (OS, Platforms, etc.), and communication
interface (if any of these apply, nonfunctional requirements such as security,
performance, policy, business rules) at the high level. The large and complex
data in specific healthcare, Hadoop ecosystem with various platforms, and other
features are explained in details.
III. Data flow
diagrams
This
section describes a description of the data flow, flow of communication, and data
processing in parallel MapReduce functions were displayed in several diagrams
with labels and a typical XML programming code.
IV. Overall system
diagrams
The section discusses an overall system design with
the communication and control unit such as Hadoop YARN and HDFS modules.
V. Communication
Flow Chart
The simplified communication flow chart used to
connect the four geographical states is displayed in a star configuration with a
high level description.
VI. Regulations,
policies, and governance for the medical industry
This
section provides regulations, policies, and governance in HIPAA for the medical
industry considered in the Cyber-Healthcare System.
VII. Assumptions and
limitations
Several
assumptions and limitations applied in the design of the
Cyber-Healthcare System are described and mentioned with
technical information of the typical operating systems.
VIII. Justification
Eight
justification and rationales of the System’s design are summarized in this
section.
In
general, the Cyber-Healthcare System that is a huge project is implemented on
Hadoop backbone to provide personal information, clinical health information
and public health information to help hospitals, outpatient clinics, insurance
companies, healthcare purchasers, etc. to provide the high-quality of effective
healthcare services at the low cost to patients in this central region.
REFERENCES
Apache Software Foundation (2014). What is apache hadoop? Retrieved November 08, 2015 from
http://hadoop.apache.org/
Borthakur, D. (2012). HDFS architecture. Retrieved August
08, 2016 from
https://hadoop.apache.org/docs/r1.2.1/hdfs_design.html#Streaming+Data+Access
CMS.gov (2005). System design document. Retrieved July
31, 2016 from
https://www.cms.gov/Research-Statistics-Data-and-Systems/CMS-Information-Technology/XLC/
Flower, J.
(1999). The revolution in our assumptions about healthcare. Retrieved
September 08, 2016 from http://www.well.com/~bbear/assumptions.html
Hadoop.apache.org. (n.d.). Privacy policy. Retrieved
September 8, 2016 from
http://hadoop.apache.org/privacy_policy.html
HIPAA Act,
(1996). The federal health
insurance portability and accountability act. .
Retrieved September 08, 2016 from http://tn.gov/health/topic/hipaa.
Hortonworks.com, (2016). Hortonworks sandbox. Retrieved
September 07, 2016 from
www.hortonworks.com/products/sandbox.
IEEE (2009). 1016-2009 - IEEE Standard for
Information Technology--Systems
Design--Software Design
Descriptions. Retrieved July 31, 2016 from
http://ieeexplore.ieee.org/xpl/login.jsp?tp=&arnumber=5167255&isnumber=5167254&url=http%3A%2F%2Fieeexplore.ieee.org%2Fstamp%2Fstamp.jsp%3Ftp%3D%26arnumber%3D5167255%26isnumber%3D5167254
Or http://ieeexplore.ieee.org/stamp/stamp.jsp?tp=&arnumber=5167255&isnumber=5167254
Intel, (2015).
Extract, transform, and load big data with apache Hadoop. Retrieved September
7, 2016 from http://hadoop.intel.com and
https://software.intel.com/sites/default/files/article/402274/etl-big-data-with-hadoop.pdf
Natarajan, R. (2012). Apache Hadoop
Fundamentals – HDFS and MapReduce Explained with a Diagram. Retrieved November
01, 2015 from http://www.thegeekstuff.com/2012/01/hadoop-hdfs-mapreduce-intro/
Nolan, J. (2015). Would hospitals benefit from ISO 9001?
Retrieved September 08, 2016
from http://advisera.com/9001academy/blog/2015/07/21/would-hospitals-benefit-from-iso-9001/
Quora (2014). What is the future of business
intelligence? Retrieved October
20, 2015 from
http://www.quora.com/What-is-the-future-of-business-intelligence.
Schneiderman, B.,
Plaisant, C., & Hesse, B. (2013). Improving healthcare with
interactive visualization methods. Retrieved September 06, 2016 from https://www.cs.umd.edu/~ben/papers/Shneiderman2013Improving.pdf